Lexi’s Ultimate Handbook of Loudness
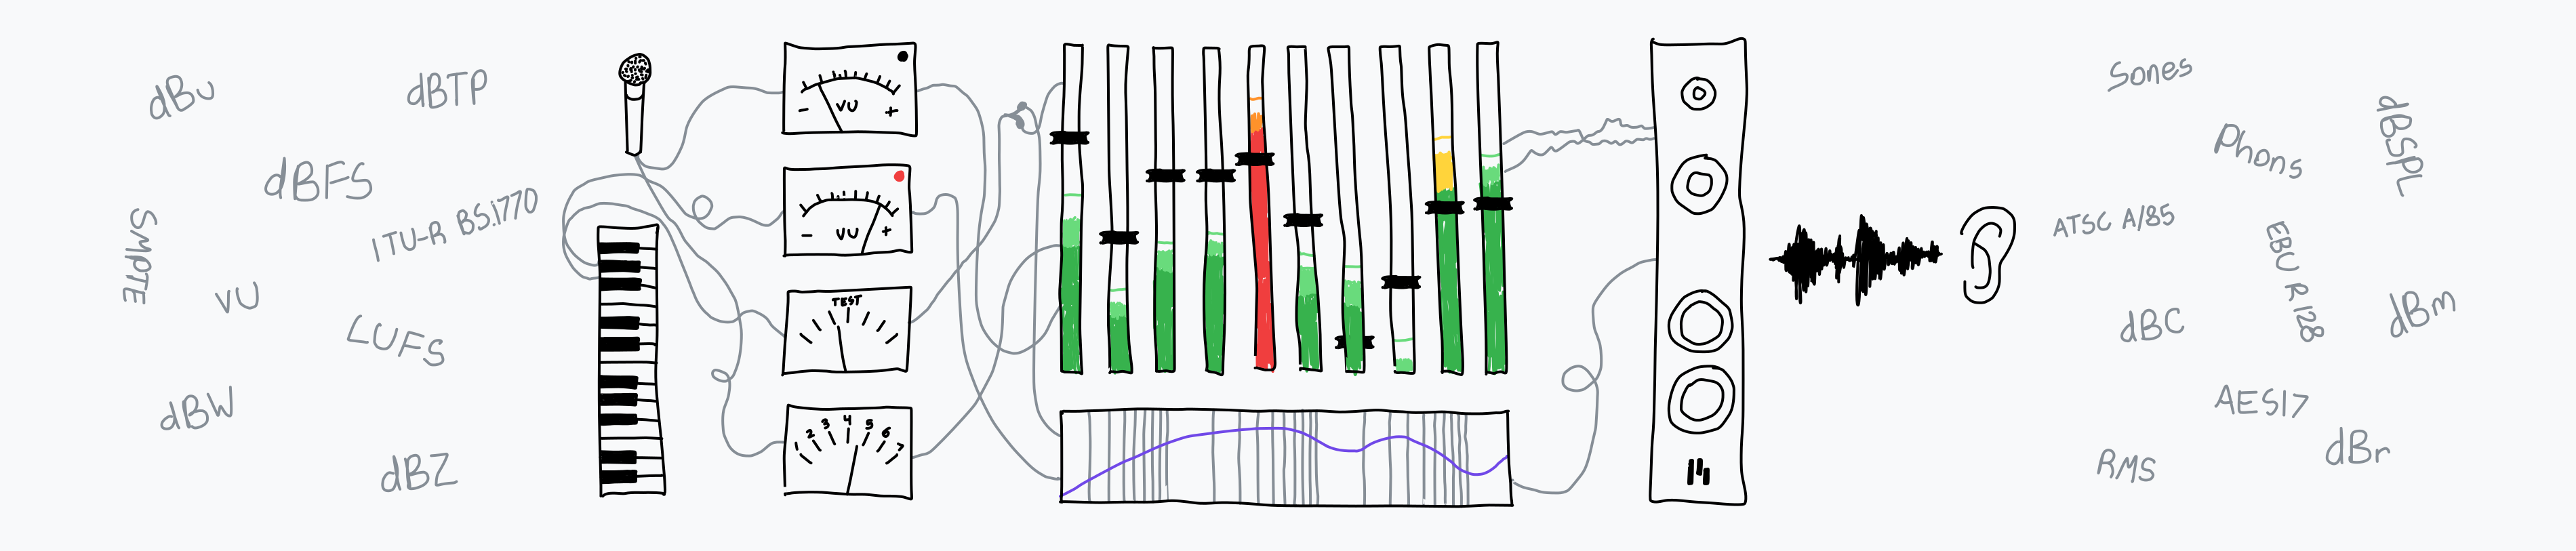
I make music, and in doing so, I interact every day with a myriad of representations of loudness. In a single day of work, I have slid a mixer fader to lower an instrument’s volume, glanced at a VU meter to monitor an analog compressor’s output, recalibrated my speakers with a sound level meter, and mastered my track while referencing an LUFS plugin.
Our field features dozens of meters and units whose specifics we have to remember. In seeking to document them all, I’ve found a shocking amount of subtle misinformation, plain falsehoods, and steep assumptions of what is “obvious” and what “everyone” knows.
This article is my attempt to create a comprehensive taxonomy of loudness meters, units, and reference levels, including where they come from and how to use them.
Meters
I will begin with meters, because I built this really cool digital replica of every major audio meter, and I want to show it to you. You can click through the below widget to play with different sounds and how their volumes are represented by different meters.
To understand the context behind these meters and the units they use, I recommend reading the rest of the article.
If you’re a software engineer, you can see the code powering these simulations on GitHub! I did some cool things, including reverse engineering the filter coefficients from ITU-R BS.1770, writing biquad and polyphase upsampling filters from scratch in JavaScript, and running the meter simulations in a web audio worklet.
Playback Controls
Units
Every meter, fader, and readout needs a scale. Different contexts call for different scales, so we’ve ended up with a lot of different units.
As you almost certainly know, the basic unit of volume is the decibel (dB). The decibel expresses the ratio between two values on a logarithmic scale.
Ratio?
Indeed. 1 dB means something different depending on whether you are expressing a ratio between two amplitudes (like audio volume) or powers (like wattage). When comparing amplitudes, a 6 dB difference is equivalent to a factor of approximately 2. When comparing powers, a 6 dB difference is closer to a factor of 4.
As a practical example, let’s imagine volume levels A, B, and C. If A = B + 6 dB, and B = 10, then A ≈ B × 2, or 20. If C = B − 6 dB, that’s essentially the same as B ÷ 2, so C ≈ 5.
Decibels are useful for expressing the relative difference between two volumes (“the snare is 3 dB quieter than the kick”), but to discuss the absolute level of a signal traveling through some medium — whether vibrating air, voltage through a wire, or bits in an audio file — we need more specific units.
Physical Air Movement
What does it mean to measure the volume of audio, anyway? The answers that most affect how we humans physically experience audio have to do with the travel of vibrations through air to our ears.
dBSPL: 20 μPa RMS in Air
This unit, decibels sound pressure level (dBSPL), is the first of many units in this article that are defined in terms of decibels relative to a fixed reference point, where “0 [Unit]” (in this example, 0 dBSPL) is that reference point, and positive and negative values represent the ratio in decibels to that point.
dBSPL is a measurement of physical movement. In air, 0 dBSPL is defined as 20 μPa RMS — micropascals, a unit of pressure — which is close to the smallest pressure a human ear can detect as sound. Measurements larger and smaller than 0 dBSPL correspond to different ratios to 20 μPa RMS.
While this is the reference point in air, it is different in other fluids, like water.
What (and why) is RMS?
Given an audio signal, it’s possible to get the instantaneous amplitude at a specific point in time. However, this is rarely useful for assessing the energy of the signal as it actually affects our ears and the environment around us. For that, we need to consider the sound over a larger time period.
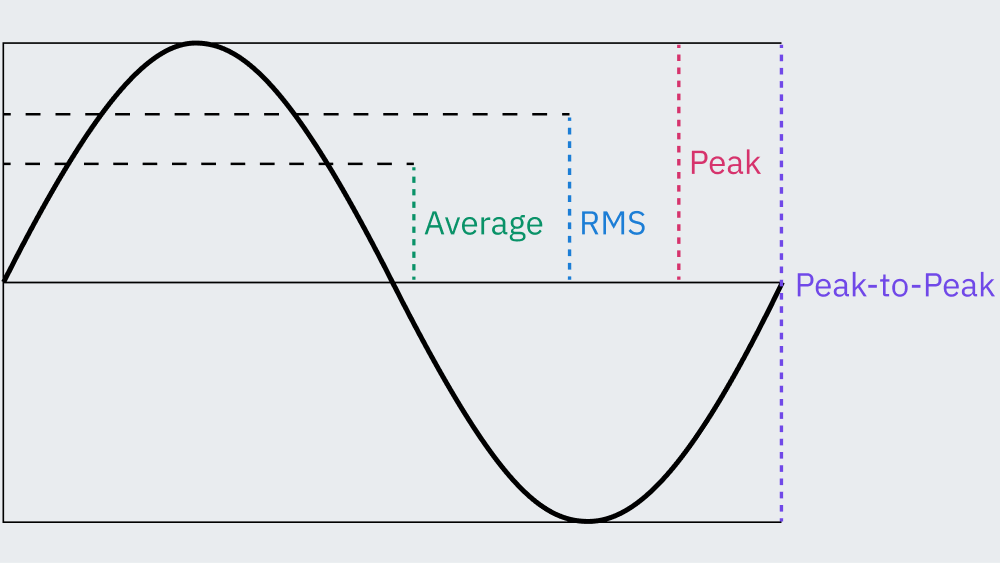
Root mean square (RMS) is how you average an audio signal over time. To calculate it from digital samples, for example, you take the amplitude of each sample, square each one, average the squared samples, and take the square root of that average.
Why not just take the plain, arithmetic average of the amplitudes? Well, a plain average gives you a level that follows the trends of the signal’s amplitude, but RMS calculates the power of the signal as defined by physics. Because sound ultimately ends as physical vibrations in our eardrums and the objects around us, power, a physical property, is much more useful for assessing how loudly we perceive things and how sound affects the world around us. For this reason, we use RMS exclusively.
When you see a dB measurement integrated over some period of time, it is almost always a measurement of the RMS of the signal over that period. The only exceptions are instantaneous measurements, like those taken by peak meters, and alternate integration methods, like the dynamics of a VU meter.
Phons
Unlike dBSPL, an objective unit relative to a fixed reference point, the phon is a subjective unit used primarily in psychoacoustics research, and rarely seen in audio engineering.
The phon describes how loud a sound feels, by comparing it to a 1000 Hz pure sine tone that feels as loud as the sound in question. A volume of 20 phons means the sound feels the same volume as a 1000 Hz sine tone played at 20 dBSPL.
By definition, that means that a 1000 Hz sine wave at 20 dBSPL will always be 20 phons loud. However, a 500 Hz sine wave at the same objective volume, 20 dBSPL, will probably have a subjective volume less than 20 phons, because different frequencies are perceived at different loudnesses by the human ear and brain.
While the relative volumes of various pure sine tones are pretty well studied in academia, the loudnesses of more complex sounds are perceived differently by different people. The volume of an arbitrary sound in phons is usually obtained by surveying lots of people in an academic study and averaging their answers or by running an imprecise estimation algorithm. This is why the phon is uncommon in audio engineering: it’s impossible to accurately objectively calculate, so it’s of limited use for making anything new.
dBA
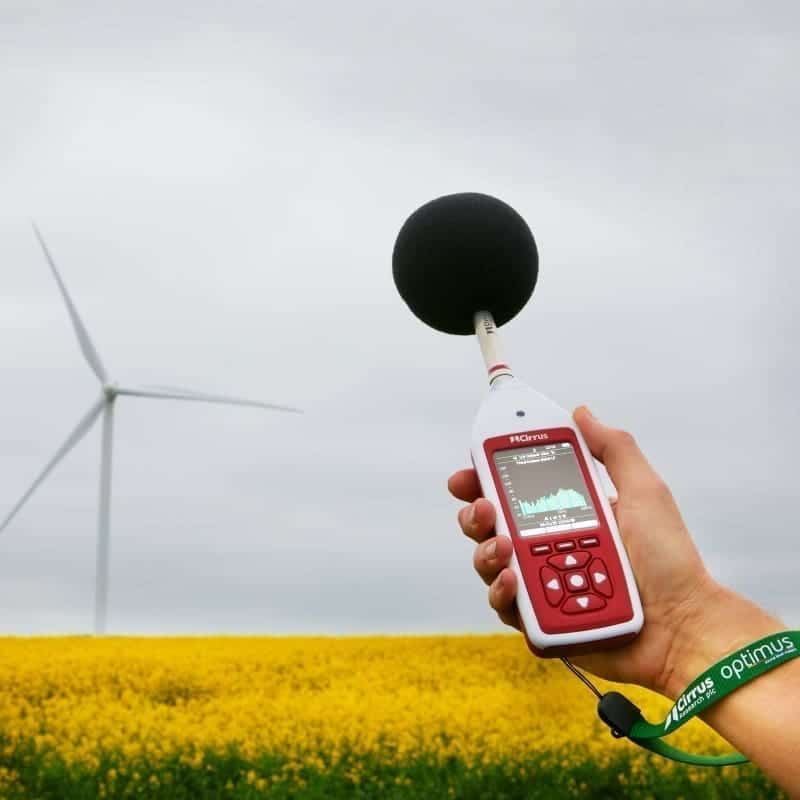
We need a better, objective unit to discuss the volume of sounds as heard by humans, then. Raw dBSPL is rarely used because, due to the way different frequencies affect the inner mechanics of our ears differently, it’s neither an effective proxy for hearing damage, nor for perceived loudness.
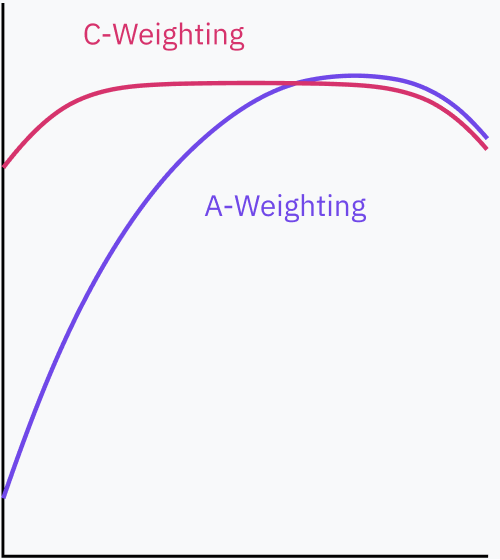
Instead, A-weighted dBSPL (dBA) is the typical unit of choice, applying a frequency-dependent weighting curve to dBSPL. If you see just “dB” used in the context of the volume of audible sounds, that is universally implied to mean dBA.
The A-weighting curve was designed to approximate the inverse of a 40-phon equal-loudness contour. This contour was determined by finding the volume offset relative to 40 dBSPL for sine waves across the frequency spectrum, such that, across study participants, each sine wave had a perceived volume of 40 phons. In other words, the A-weighting curve is designed to compensate for our brain’s inconsistent perception of the intensity of different pitches, based on the results of having test subjects compare various sine waves to a 1000 Hz reference sine wave.
Luckily enough, A-weighting not only matches how different pitches sound, but is also a reasonable predictor of human hearing damage to a sound given the microphone response of typical sound level meters measuring that sound. This led to dBA’s widespread use in regulatory contexts.
Many large concert venues require the touring mixing engineer to limit themselves to a maximum volume. This is usually specified in dBA.
dBC
Sometimes, C-weighted dBSPL (dBC) is used instead of dBA. This unit is sometimes written as dBc, which is incorrect and confusing — dBc is a real unit in telecommunications that means something different altogether!
While the A-weighting curve follows an inverted 40-phon equal-loudness contour, the C-weighting curve is based on an inverted 100-phon contour — the result of higher-volume human testing. With a flatter curve including more bass, C-weighting better approximates the perceived volume of loud sounds, like those at concerts. Sound level meters that are certified to IEC class 1 are required to support dBC.
dBZ
You may occasionally encounter this unit, dBZ. The “Z” does not designate its own weighting curve; this unit means zero-weighted dBSPL. If it’s not weighted, how is this unit any different from normal dBSPL? Well, dBZ is defined with a specific frequency range that it has a flat response over, and a specific error tolerance. This matters for certification and standards in some industries.
A different dBZ is also used to represent reflectivity in weather radars, but if you’re reading this article, that’s probably not relevant to you.
dBB/dBD
These units are B-weighted and D-weighted, respectively. These two weighting curves are largely unused, these days. The K-weighting curve used to calculate LUFS, which we will discuss later, is a descendant of the old B-weighting curve. The D-weighting curve was designed for aircraft noise but never became as ubiquitous as A-weighting and C-weighting.
Sones
Psychoacoustics discussions need a unit that can intuitively represent ratios. The sone was created to be that unit: a 2-sone vacuum cleaner is designed to be half the perceived volume of a 4-sone one.
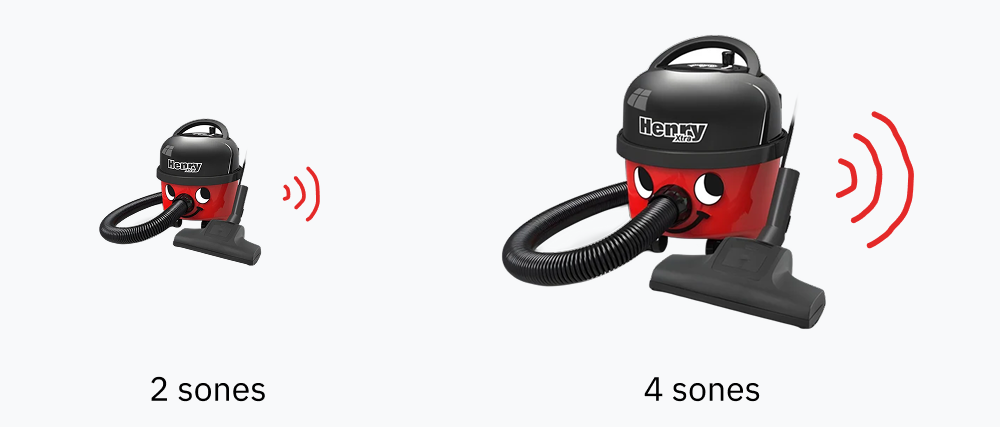
Sones versus decibels:
Decibel-based scales are modifying the volume of audio in consistent, relative increments. For example, subtracting 6 dB will have roughly double the audible difference of subtracting 3 dB.
Sones are more useful for comparing the perceived volume of sounds in the context of psychoacoustics research.
Sones are defined in terms of phons, where 1 sone = 40 phons, and after that the loudness in sones doubles for each increase of 10 phons. Below 40 phons, the relative volume of sounds is less consistent, so different, specialized formulas are used based on our knowledge of psychoacoustics.
The sone is largely unused in the context of audio engineering for a reason similar to why the phon is avoided. They are both subjective units that cannot be quantitatively measured or usefully converted to other unit systems.
Analog Audio
Sound needs to get to your ears somehow, so we have speakers that vibrate the air in response to electrical voltage. Voltage is a measure of the electric potential between two points in a circuit: 0 volts (V) sent to a speaker means there’s no electrical pressure and is generally the center of the audio signal, and positive and negative voltages move the speaker diaphragm in opposing directions.
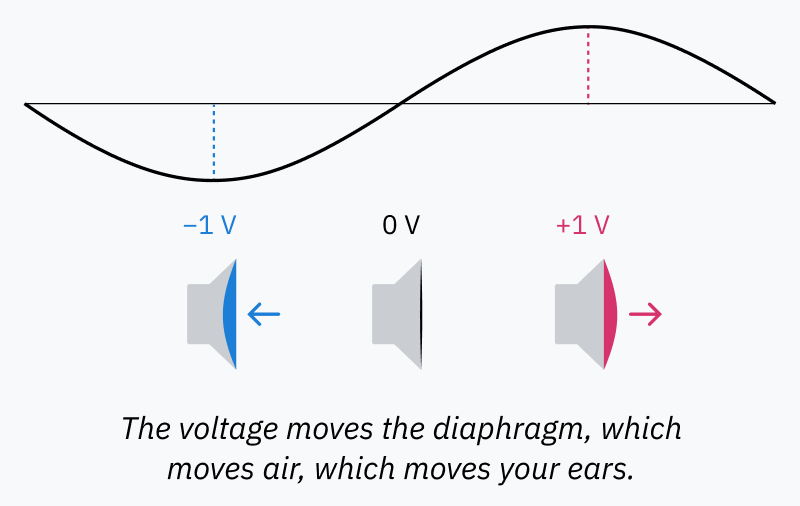
Until computers and digital audio revolutionized sound production, only analog audio, where the amount of voltage traveling through a wire corresponds to the amplitude of the sound wave, was relevant to electronic musicians.
It remains critical to deeply understand analog audio even as a digital-only producer, because all sound that is recorded or played back must pass through the analog world to travel between the digital and physical worlds. Historical context from analog audio also shapes many of the digital tools and conventions we use today.
dBW: 1 W
The watt (W) is a measurement of electric power — voltage multiplied by current. The decibel-watt (dBW) expresses power as decibels relative to 1 W.
Because most of this unit’s range represents very large wattages, it typically isn’t used in audio production contexts. However, you might see it in older manufacturer specifications of amplification power. For example, the Musical Fidelity M8s-700m power amplifier advertises a rated power output of 28 dBW.
Decibel watts can also be useful for calculating the volume of a speaker in dBSPL for some input. Speaker sensitivity is typically measured in the dBSPL at 1 W of power from a 1 meter distance. If you have a speaker with a 90 dBSPL sensitivity (at 1 W / 1 m) and drive it with a 20 dBW amplifier, you can add the numbers together to calculate an expected volume of 110 dBSPL at the same 1 meter distance. This works because dBW expresses a ratio to 1 W; since the dBSPL value is measured at 1 W, adding the two numbers is equivalent to multiplying by the driving wattage.
dBm: 1 mW?
Decibel-milliwatts (dBm) is just like dBW but referenced to 1 mW (0.001 W) instead of 1 W. Because dBm better represents the smaller power levels used in analog audio, dBm is often used for discussing audio levels.
However, dBm often (erroneously?) means decibels relative to 0.775 V. This is a relic of old telephone systems, which ran at a standard impedance of 600 Ω. By Ohm’s law, 0.775 V was the voltage necessary to drive 1 mW through those 600 Ω systems. Because these conventions were so ubiquitous, dBm ended up referring to decibels relative to 0.775 V instead of relative to 1 mW.
dBu/dBv: 0.775 V RMS
Because dBm became ambiguous, a new unit was created, unloaded decibels (dBu), which is officially defined as “the RMS voltage that would dissipate 1 mW in a 600 Ω load” — in other words, 0.775 V.
dBu was originally named dBv, but dBv is now avoided because the name can be easily confused with the next unit we’ll discuss, dBV. In some cases, you might even see dBv written when dBV is actually intended, so watch out!
dBV: 1 V
Decibel-volts (dBV) began to be used for audio because, honestly, it’s a bit silly to use the relic that is 0.775 V as a reference. dBV is defined simply as decibels relative to 1 V.
Since sound is created by constantly varying the voltage (electric potential) through a speaker circuit, dBV on its own is ambiguous as to whether it’s referring to the RMS of the signal or an instantaneous peak measurement. Usually, though, you can safely assume it means RMS.
VU/dBVU: +4 dBu… Sometimes!
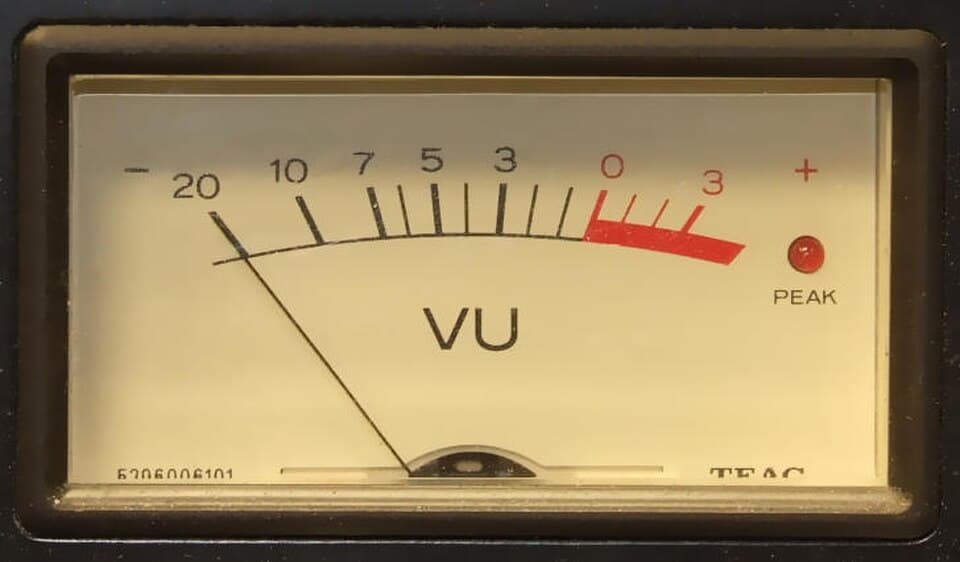
The VU unit is a bit of an odd one out. Rather than a measurement of air pressure or electric potential, it refers to the reading on a VU meter — archetypically, a physical analog device. For VU readings to be comparable to other units, you need to know, among other things, what level the VU meter was calibrated to.
While VU meters can be calibrated differently, they are traditionally set to a reference of 0 VU = +4 dBu, and have an integration time (the window of time the needle smoothes the signal over) of 300 ms. Because VU meters are marked with a decibel scale, you will sometimes see decibels VU (dBVU) used to mean the same thing as VU.
VU meters have characteristic physical behaviors, usually collectively called the ballistic response, that cause certain needle movements and damping in response to changes in volume. VU meters’ ballistic responses are a product of their analog circuitry, the construction of which is relatively standardized, and gives them the personality that helped lead to their popularity. The typical ballistic response precisely matches neither the simple average nor the true RMS power measurement over the integration period, although it is closer to a flat average than the RMS. A common misconception is that VU is a measurement of RMS. Traditionally, it is not.
Many DAW plugins are available that simulate analog VU meters. Of course, it’s not possible to calibrate a DAW plugin’s VU meter with a reference value in dBu — digital audio works in bits, not voltage — so the calibration is often configured in dBFS RMS. What value is used, then? Typically, the dBFS value corresponding to +4 dBu of analog output. This value depends on your preferred alignment level, which has conventions varying by country and standard (film vs. broadcast vs. CD) between −12 dBFS and −20 dBFS.
What’s dBFS? Glad you asked!
Digital Audio
dBFS/dBO/dBov
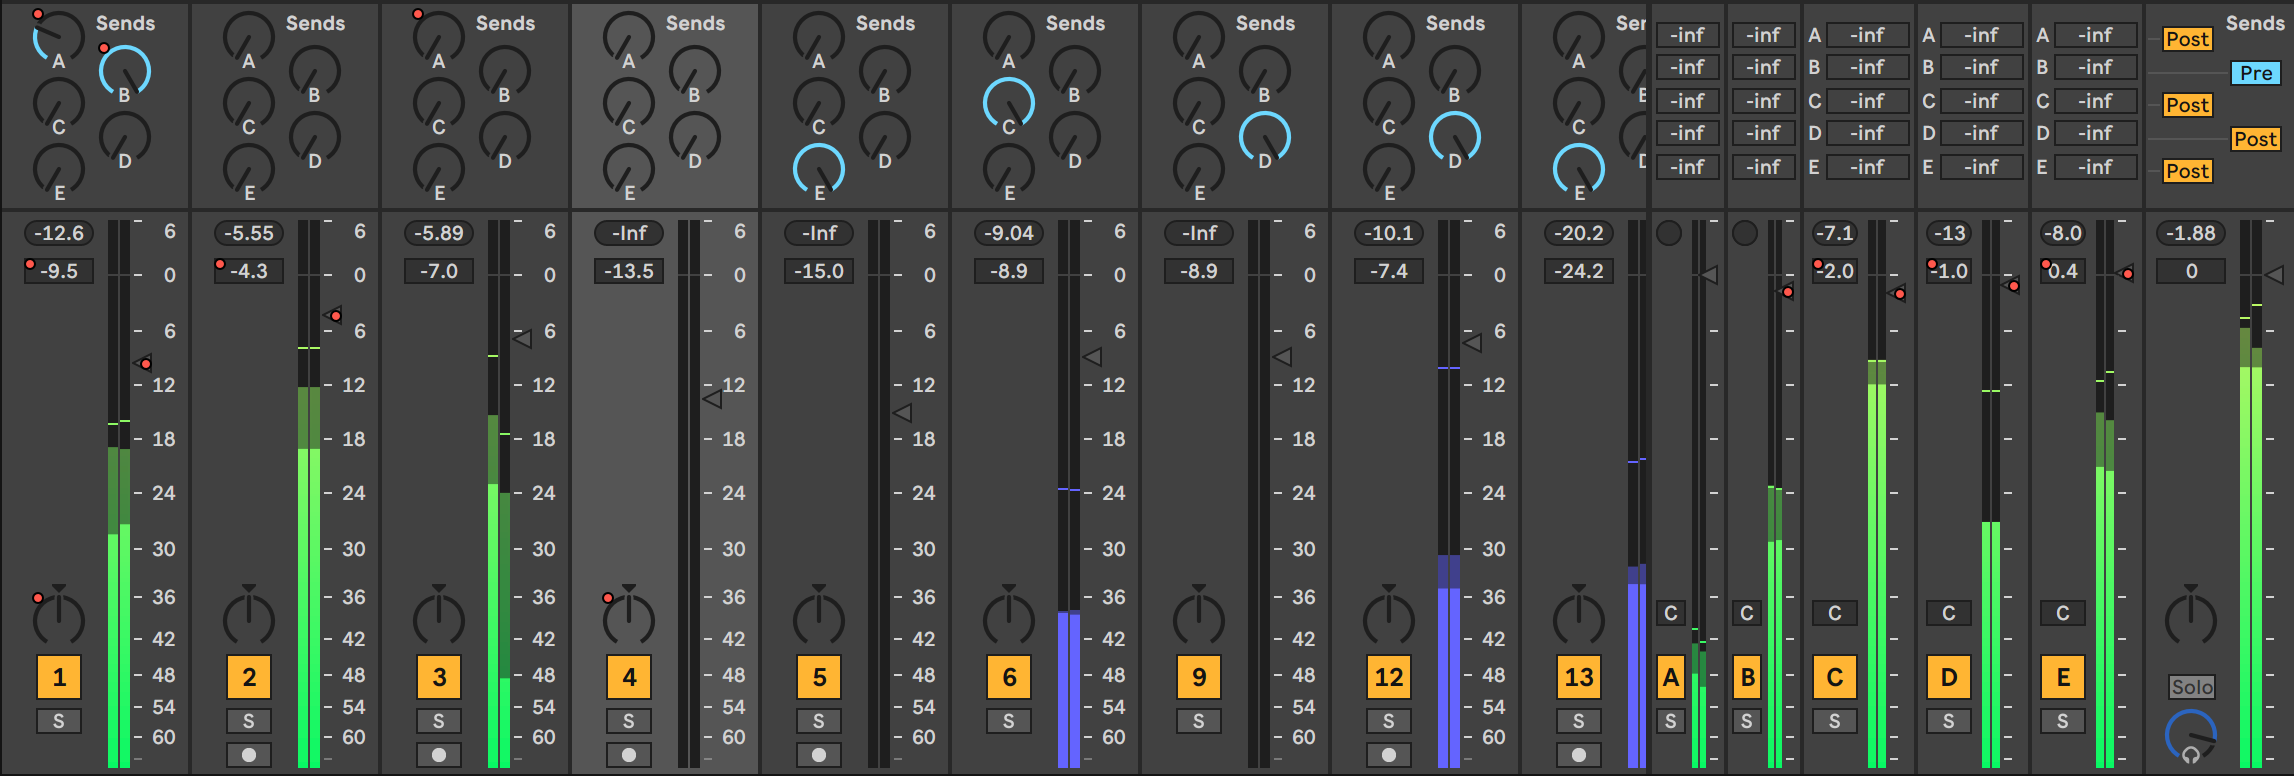
This unit, called either decibels full scale (dBFS) or decibels overload (dBO/dBov), specifies volume relative to the maximum representable amplitude in the digital format being used. For example, in 8-bit signed fixed-point formats, 0 dBFS is 127/−127. In floating-point formats, 0 dBFS is 1.0/−1.0.
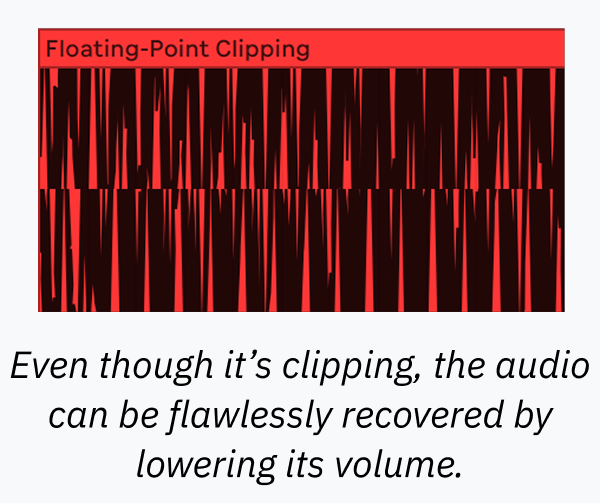
Because floating-point numbers can represent values larger than 1.0, floating-point audio can store audio louder than 0 dBFS without clipping. This is why floating-point audio is typically described as having better headroom than fixed-point audio, which, by nature, clips above 0 dBFS. This means that, when working in floating-point formats, it’s generally completely fine to go above 0 dBFS — it might be uglier in waveform displays, but until you convert to a non-floating-point medium (like playing it through your speakers, or directly converting to fixed-point) you won’t lose information and can always scale it back down.
While dBFS peak is well-defined, dBFS RMS can be more ambiguous. Sometimes, dBFS RMS refers to the mathematical definition of RMS, where the RMS of a full-scale square wave is 0 dBFS and the RMS of a full-scale sine wave is around −3 dBFS. However, the AES17 standard for audio engineering dictates that dBFS RMS should actually have a built-in +3 dB offset so a full-scale sine wave is 0 dBFS and the square wave is +3 dBFS. In my experience, the +3 dB AES17 system is more common than the version of RMS without the offset, but it really can go either way. When the units dBO and dBov are used, which is rare, they refer to non-AES17 RMS, where a full-scale square wave is 0 dBO.
When DAWs display dBFS RMS meters, the calculation is typically done over a period of 300 ms. It’s not a coincidence that this matches the integration period of traditional analog VU meters!
dBTP
A track mastered with audio never going above 0 dBFS means no single sample will clip. However, reconstructing a continuous waveform from these discrete samples — necessary both for digital-analog-conversion for playback and for many compression codecs, like those used for MP3 files — can yield a waveform with inter-sample peaks louder than the samples’ values themselves. Any system that can accurately calculate the volume of these inter-sample peaks displays volume in decibels true peak (dBTP).
Some meters will be labeled as dBFS but actually supersample to a higher sample rate to approximate the dBTP. For example, I noticed that Ableton Live 10 renders dBTP in the visual volume meter, but dBFS in the peak value window. After upgrading to Ableton Live 12, the peak value window now also displays dBTP.
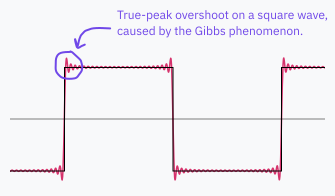
Why do these inter-sample peaks occur? If you’ve studied how digital audio works, you may know that the Nyquist–Shannon sampling theorem tells us that, if recording at a sample rate greater than twice the maximum frequency of an audio signal, you can always perfectly reconstruct the original signal. Indeed, because modern DACs can reconstruct an analog audio signal from a digital audio file — using Whittaker–Shannon interpolation, also called sinc interpolation — if the original analog signal had peaks louder than the resulting digital samples, then the perfect reconstruction will include those peaks. These inter-sample peaks are why dBTP matters.
A common example of inter-sample peaks is with square waves. Because discontinuous signals like perfect square waves would theoretically have infinitely high frequency components, they need to be low-pass filtered below the Nyquist frequency before they can be digitally sampled. This low-pass filter causes overshoots at the discontinuities in the signal, an effect called the Gibbs phenomenon. You can see this in action by comparing the square wave sound between the peak and true peak meters earlier in this article.
LUFS/LKFS/dBK
The International Telecommunication Union (ITU), an agency of the United Nations, created loudness, K-weighted, relative to full scale (LKFS) in the ITU-R BS.1770 standard to provide a good unit for measuring the perceived loudness of digital audio, especially for regulating volume for TV and radio broadcasting. An alternate name, loudness units relative to full scale (LUFS), was later introduced by the European Broadcasting Union (EBU) in the EBU R 128 standard, and has become the more common name. Occasionally, this unit is also called K-weighted decibels (dBK), but this is weird and nonstandard and only included here for completeness.
LUFS is one of the most important units of loudness to understand today, because most audio and video streaming services, including Spotify, Apple Music, YouTube, and Netflix, normalize tracks based on their volume measured in LUFS.
LUFS is defined as dBFS compensated for the K-weighting curve, which is a standardized curve that is better at approximating humans’ frequency-dependent perception of loudness than either the A-weighting or C-weighting curves. LUFS is calculated with an RMS measurement (without the AES17 +3 dB offset), and algorithms for calculating it for multi-channel configurations like surround sound are highly standardized by the ITU and EBU. Longer-term measurements of LUFS are also gated: chunks of audio below a certain volume are ignored, better representing the overall loudness of the audio track.
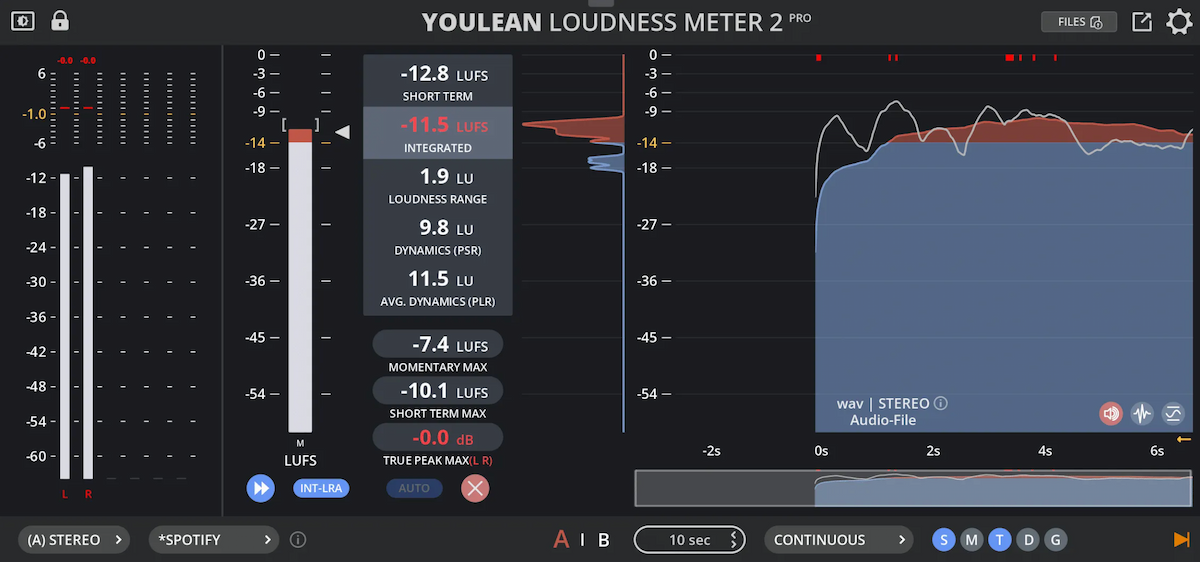
Overall, LUFS is a holistic standard for approximating the perceived loudness of audio content, and it’s crucial to understand when distributing your audio. When mixing programs for broadcast, you have strict LUFS limits to adhere to. When mixing music for streaming, each platform has an LUFS target that your music will be scaled to hit — that means if you don’t use your dynamic range well, your music can end up being scaled down to sound quieter and lower-quality than other songs. Even when you’re not distributing to a platform that cares about LUFS, it’s useful to know how loud your track sounds!
LU
You might see loudness units (LU) used as a relative unit when comparing two LUFS values. Just as −12 dBm is 2 dB louder than −14 dBm, −12 LUFS is 2 LU louder than −14 LUFS.
dBr
Some documentation, plugin manuals, and papers might use dBr. This unit just means decibels relative to the reference — its meaning is defined by the context it’s mentioned in.
Leveling in the Real World
Now that we’ve grasped the vast collection of units we use, we can examine the most common standards that audio is referenced and calibrated to across different mediums.
Line Level

Audio devices that connect to each other benefit from a common line level: a reference level shared across different analog devices to simplify leveling and compatibility. The standard line level for consumer audio devices like CD players and home stereo systems is −10 dBV. This is notably different from professional audio equipment, which uses a line level of +4 dBu. (Don’t you love how it’s a different unit?)
Often, anything with 3.5mm or RCA jacks is −10 dBV, and anything with dual balanced TRS 1/4" or XLR out is +4 dBu. It’s useful to keep this difference in mind when connecting consumer audio devices to professional equipment — you might have to boost the level more than expected, and noise can begin to be a concern.
By the way, the standard calibration of VU meters, mentioned earlier, is why the line level for professional audio uses the same reference of +4 dBu.
Microphone Level and Instrument Level
Microphone level and instrument level are two terms that are much more ambiguous than line level is. There’s no standardized voltage or even range for either, but both terms typically refer to weak signals that need to be amplified. Often, instrument level signals carry high output impedance. Microphone level signals sometimes come with a requirement for phantom power.
Alignment Levels
Until now, we’ve separated the digital world, where dBFS, DAWs, and effect plugins power your workflows, from the analog world, where dBu, line level devices, and speaker systems let you bring your sounds to the physical world. At some point though, you will need to relate your digital levels to analog levels, and so it’s useful to choose a fixed reference point between dBFS and dBu. This is an example of an alignment level, a defined anchor point between different unit systems.
Choosing an alignment level is useful because it allows each digital amplitude to correspond to an analog voltage in a way that is consistent throughout your entire recording, production, mixing, and mastering process. You can use the same reference when recording line in audio from your keyboard, calibrating your digital VU meter, and sharing your track with a mastering engineer. Here’s where I get opinionated: even if you’re just going to work in your DAW and release straight to streaming or Soundcloud, you should pick an alignment level because it will give you plenty of headroom, a consistent framework to work inside, and compatibility with a world built on decades of the assumption that you will have one.

What alignment level should you use, then? Is there a standard choice across the globe? Of course not. But, at least in the United States where I live, the Society of Motion Picture and Television Engineers (SMPTE) defined +4 dBu — the professional line level in the United States, and also equivalent to 0 VU — as −20 dBFS. This is by far the most common standard among producers and audio engineers and matches the headroom that practically every piece of professional analog equipment can handle.
While I recommend using the SMPTE standard, it’s worth noting that you will sometimes come across −18 dBFS = 0 dBu used, which is the European standard set by EBU R 68, and has slightly less headroom than the SMPTE alignment level. European broadcasting bodies traditionally used a reference of 0 dBu for analog audio and peak programme meters.
Looking Backward: K-system
In 2000, near the peak of the loudness wars, mixing engineer Bob Katz had enough of musicians making louder and louder music while decreasing dynamic range, and he published a proposed solution to the problem: a standard set of levels and headroom for mixing called the K-system (no relation to K-weighting). The system had three configurations: K-20, K-14, and K-12.
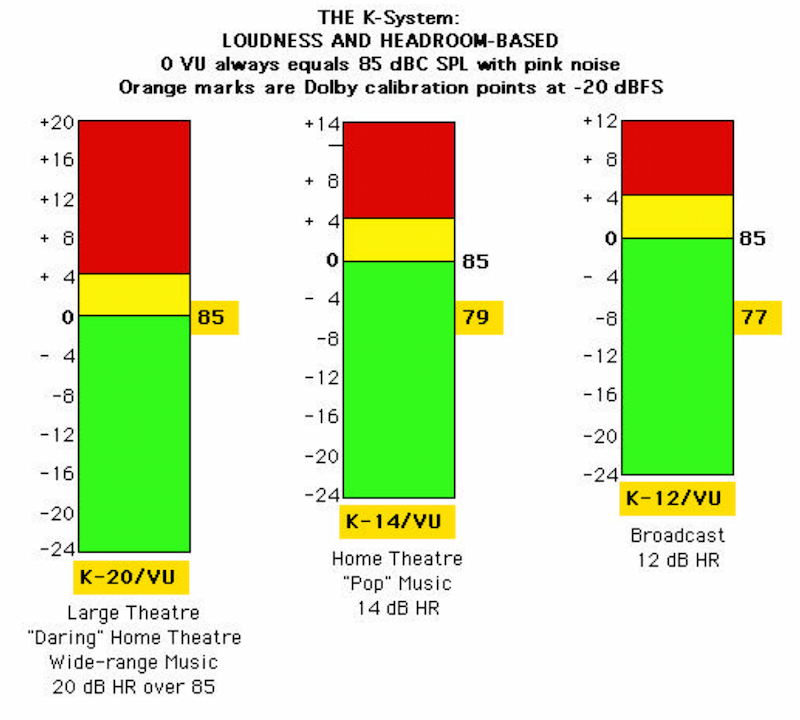
The original K-system had you put a VU meter on your master track and use a sound level meter to set your speaker gain so 0 VU = 85 dBSPL at the listener’s position. The only difference between the different configurations is the setting of the VU meter and therefore the headroom. K-20 had the VU meter set to −20 dBFS, K-14 was −14 dBFS, and, as I’m sure you can guess, K-12 was −12 dBFS.
Audio engineering has progressed a lot since then, and Bob Katz himself has said that the K-system is now largely obsolete. However, you will still see K-meters around in software like Bitwig, and, because it matches the SMPTE alignment level of −20 dBFS, the K-20 meter especially maintains its usefulness.
Looking Forward: EBU R 128 and ATSC A/85
10 years after Katz introduced the K-system, he collaborated with the committee creating EBU R 128, a European standard for the loudness normalization of audio. In addition to introducing LUFS as an alternative unit to LKFS, EBU R 128 requires television and radio programs to master to a target loudness of −23 LUFS (± 0.5 LU) and a maximum true peak of −1 dBTP. For this reason, EBU mode meters use units of LU where 0 LU = −23 LUFS.
In the United States and Canada, the common standard is instead Advanced Television Systems Committee (ATSC) A/85, which dictates a target loudness of −24 LUFS (± 2 LU) and a maximum true peak of −2 dBTP. You might notice that these numbers are very similar — something mixed for R 128 will almost always also be compliant with A/85.
Both of these standards are very relevant to broadcast and cinema, and much less so for music. However, you might notice that the target numbers are very similar to where you’ll likely already end up at when mastering to the SMPTE alignment level of −20 dBFS = +4 dBu, which is also going to be close to the EBU alignment level of −18 dBFS = 0 dBu. That makes these very easy standards to accidentally follow, and if you’re just making music or other audio for digital distribution, you probably shouldn’t ever care or think about them again!
These modern standards are less specific than Katz about how to set your speakers. The best answer nowadays is whatever sounds good to your ears. The standard for cinema is still typically +4 dBu = 85 dBC, but as low as +4 dBu = 73 dBC is common for music production.
Conclusion and Application
By now, you know there are a lot of choices, and you should be well-equipped to make them yourself. You will know a mix is good if you use the unique tool called “your ears” to tell if it’s good.
However, if you want prescriptivism, here is some of that:
- Just mix around −20 dBFS. This doesn’t mean your output is expected to peak at −20 dBFS — that would be much too quiet. Your peaks can and should be a lot higher, around −12 dBFS is typical but it depends a lot on your genre.
- If you’re using a VU meter, calibrate it so −20 dBFS = 0 VU. When mixing, you can target −23 LUFS, which will roughly match.
- It’s totally fine to run a bit hot. Lots of amazing musicians don’t pay attention to any of this and still make great music.
- If you care about calibrating your speaker volume, calibrate them one channel at a time such that band-limited pink noise at +4 dBu (−20 dBFS RMS or 0 VU, here are some test files) is anything between 73 dBC and 85 dBC. You probably don’t need to shell out for a sound level meter, it turns out an app on your phone is almost as accurate. Your ears are pretty good, too.
- When mastering for louder volumes (for example, Spotify’s target is −14 LUFS, and you can push CDs to like −10 LUFS) you’ll probably need to bump your gain about 10–15 dB. Depending on how peaky your mix is, this is what limiters are for.
There are a lot of people on the internet with terrible mixing advice, and I might be one of them. There are a lot of people on the internet with great mixing advice, and I’m probably not one of them. I hope after reading this article, you’ll be better equipped to make your own, intentional, and informed choices for your mixes. If you have any questions, comments, or corrections, I’m happy to help or hear at hi@kognise.dev.
Toodles!
Acknowledgements
- Music clip for the audio player is an edit of “I Got a Stick Arr Bryan Teoh” by Kevin MacLeod, licensed under CC BY-SA 4.0
- Photo of the sound level meter is by AnaFields, licensed under CC BY-SA 4.0 and sourced from Wikimedia Commons
- Photo of the VU meter is by Iain Fergusson, licensed under CC BY-SA 3.0 and sourced from Wikimedia Commons
- Photo of the collection of musical instruments is by Steve Garry, licensed under CC BY 2.0 and sourced from Flickr